
The figures behind this report
Complete responses returned by openFDA for the two specified monthly cohorts. September and October use the same inclusion field: decision date. Source releases: 2026-11-09 and 2026-11-09. Retrieved November 20, 2026 (Asia/Kuala Lumpur).
| Measure | September 2026 | October 2026 |
|---|---|---|
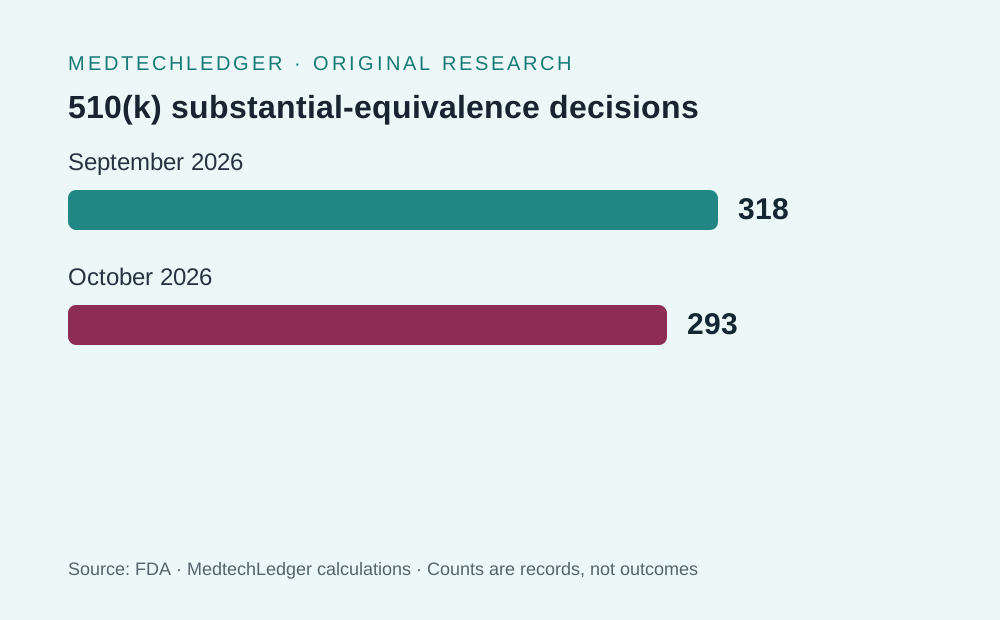
| 510(k) clearances (SESE) | 318 | 293 |
| De Novo grants in this feed (DENG) | 2 | 2 |
| Distinct applicant strings | 291 | 267 |
Counts describe this dataset and snapshot. Applicant and firm names are exact source strings, without parent-company consolidation. Event totals are distinct within each month; the same event may appear in both monthly cohorts.
MedtechLedger’s decision-date count shows 293 510(k) clearances in October 2026 versus 318 in September, using SESE K-number records only and excluding the two DENG records in each month because they are De Novo grants, not 510(k) clearances [1][2]. That is a month-to-month comparison of database records, not a measure of FDA efficiency, market share, sales, clinical value, or a forecast of any longer pattern [1][2]. The October source snapshot was retrieved on 2026-11-19 from an openFDA response whose source update date is 2026-11-09; the September snapshot carries the same source-update date and was also retrieved on 2026-11-19 [1][2].
What the October count does and does not say
The October response contains 295 total decision-date records, split between 293 SESE entries and 2 DENG entries, with MedtechLedger counting only the SESE records as 510(k) clearances [1]. The September response contains 320 total records, split between 318 SESE entries and 2 DENG entries, under the same decision-date rule and the same exclusion of DENG from the clearance count [2].
Because the denominator is the complete response for each month, the comparison is a record count from a fixed snapshot rather than a partial sample [1][2]. It says nothing about device quality, adoption, or whether FDA review was faster or slower. The same caveat applies to the applicant list and panel mix: they describe the month’s record set, not market rank or commercial strength [1][2].
How the month-to-month change breaks down
The raw difference is 25 fewer SESE clearances in October than in September, a decline of 7.9% when October is compared with September using MedtechLedger’s counts [1][2]. That change is real within the database query, but it is only a two-month comparison. It should not be stretched into a trend line or read as evidence of a durable direction [1][2].
The record totals show a small De Novo component in both months: 2 DENG records in October and 2 DENG records in September [1][2]. Those entries remain part of the openFDA decision-date population but sit outside the 510(k) clearance total used here, so anyone auditing the math should keep the two categories separate [1][2][4][6].
Suggested audit workflow for this exact comparison
Start by matching the October and September CSV exports to the openFDA decision_date query windows, then confirm that the month totals reconcile to the SESE and DENG code counts shown in the MedtechLedger calculations [1][2]. Next, sample applicant strings exactly as written, since punctuation and suffix differences can split what may look like one company into multiple database entries [1][2].
If you need specialty mix reporting, keep the panel labels at the FDA panel level and report them with the month-specific counts rather than trying to translate them into market categories [1][2][6]. That approach preserves the source record structure and avoids implying more than the data can support [1][2].
Panel mix shifted, but the interpretation stays narrow
October’s leading panels were Cardiovascular at 38, Orthopedic at 37, Radiology at 36, General, Plastic Surgery at 31, and Dental and Neurology at 23 each [1]. September’s leading panels were Orthopedic at 41, Radiology at 40, Cardiovascular at 39, and General, Plastic Surgery at 38, followed by Gastroenterology, Urology at 29 [2].
That comparison suggests a modest change in the monthly mix, with October showing lower counts in several of the largest panels and a stronger relative position for Dental and Neurology than in September [1][2]. It still remains a count of cleared records by panel, not evidence that one specialty is growing faster in the market or that review quality changed [1][2]. The panel labels themselves are FDA panel categories, which is the only level of interpretation supported by these sources [1][2][6].
Applicant strings matter, and they are messy by design
The applicant field in both months is best read literally, because the exact strings vary in spelling, punctuation, suffixes, and abbreviations. October’s high-frequency applicants include Anhui JBH Medical Apparatus Co., Ltd. at 5, and several entities at 3 or 2 such as Tdm Co., Ltd., Roche Diagnostics, Smith & Nephew, Inc., Avicenna.Ai, and Beckman Coulter, Inc. [1]. September’s list is different, led by Karl Storz SE & CO. KG at 5 and Zhenjiang Assure Medical Equipment Co., Ltd. at 4, with Spident Co., Ltd., Fujifilm Corporation, and Arthrex, Inc. among the next cluster [2].
The exact strings are not interchangeable. October includes both Smith & Nephew, Inc. and Smith & Nephew Medical, Ltd., while September lists Smith & Nephew Medical, Ltd. once at 1 and Smith & Nephew, Inc. does not appear in the higher-frequency entries shown in the September excerpt [1][2]. That kind of variation is useful for record-keeping but not for inferring corporate strategy or consolidated corporate volume [1][2].
Why source dates and query rules are part of the story
Both monthly analyses use the same inclusion rule: decision_date within the month window, with complete openFDA response retrieval and the CSV output stored by MedtechLedger [1][2]. October was retrieved on 2026-11-19T20:54:19.975412+00:00 and September on 2026-11-19T21:00:33.326472+00:00; both cite source_updated_at 2026-11-09 [1][2]. That means the two counts were derived from the same FDA source release date, which helps make the comparison internally consistent [1][2].
The FDA pages separate the concepts that matter here. The 510(k) program is about substantial equivalence determinations, while De Novo classification is a separate pathway for devices with no legally marketed predicate [3][4][6][8]. FDA also states that a De Novo request may follow an NSE determination or be filed directly when no predicate exists, which is why the DENG records should not be folded into the 510(k) count [4][6][8].
What can be checked directly in the data
A simple reconciliation check is that October’s 295 total records equal 293 SESE plus 2 DENG, and September’s 320 total records equal 318 SESE plus 2 DENG [1][2]. A second check is that the reported clearance count equals the SESE count in each month, because MedtechLedger defines clearances that way in both queries [1][2].
A third check is that the source update date is identical across the two monthly snapshots, which limits date-drift concerns when comparing October and September [1][2]. A fourth check is that both queries use the same field, decision_date, rather than receipt date or any other date field [1][2]. A fifth check is that the De Novo explanation in FDA’s own material matches the exclusion rule used here: De Novo is a separate classification pathway, not a 510(k) clearance [4][6][8].
What a cautious reader should carry forward
The useful finding is simple: October 2026 had fewer decision-date SESE 510(k) clearance records than September 2026, with the decline concentrated in a lower total record count and small shifts in panel mix and applicant ranking [1][2]. That is a database statement, not a judgment about FDA performance or device demand [1][2].
For anyone auditing the result, the right next step is to inspect the linked MedtechLedger CSV files and complete queries for the exact record set behind each month [1][2]. For anyone reporting the figure, the safe framing is month-over-month only; the data do not support a broader forecast, and they do not justify reading two months as a long-term direction [1][2].
Sources & references
- MedtechLedger calculation from the complete FDA october 2026 510k response · api.fda.gov
- MedtechLedger calculation from the complete FDA september 2026 510k response · api.fda.gov
- Premarket Notification 510(k) · U.S. Food and Drug Administration
- De Novo Classification Request | FDA · www.fda.gov
- The 510(k) Program: Evaluating Substantial Equivalence in Premarket Notifications [510(k)] · www.fda.gov
- Device Classification Under Section 513(f)(2)(De Novo) · www.accessdata.fda.gov
- How to Study and Market Your Device | FDA · www.fda.gov
- Evaluation of Automatic Class III Designation (De Novo) Summaries | FDA · www.fda.gov